Slam Dunk Contest scoring analysis
This analysis was done as a statistics class fun extra-credit project.
Background
The National Basketball Association (NBA) holds an annual Slam Dunk Contest during the NBA All-Star Weekend. Originally created in 1976 by the American Basketball Association as a halftime event, the format and scoring methodology have changed multiple times throughout the years.
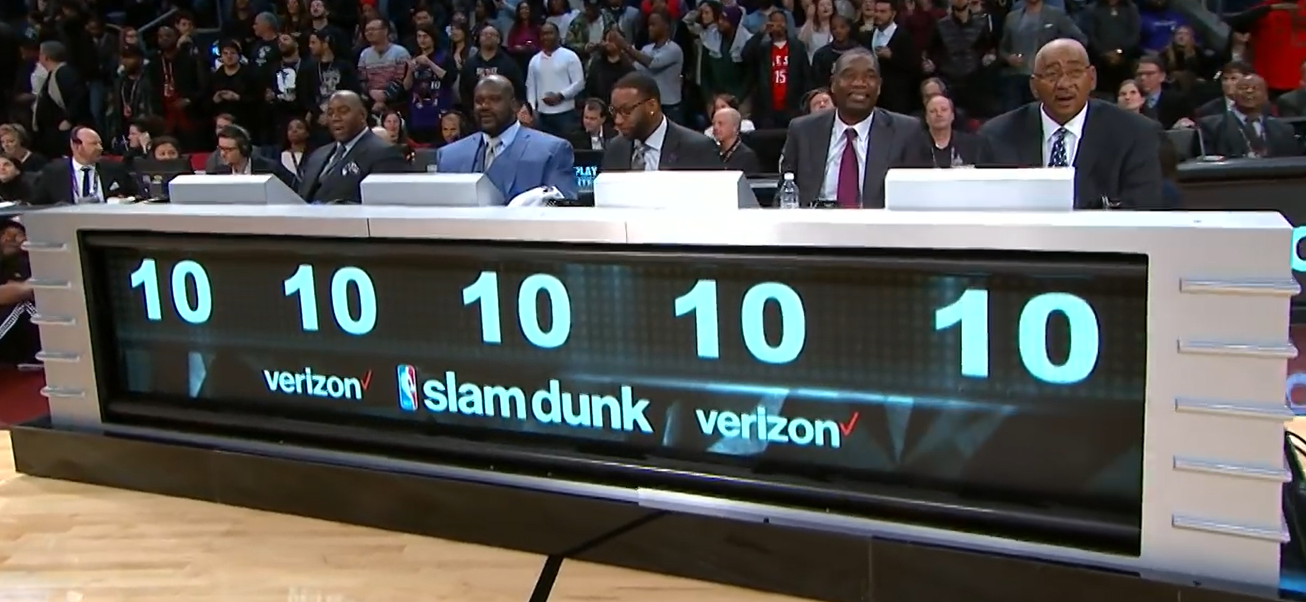
From 2000 – 2022, different final formats were tried but the calculation of scoring dunks in the first rounds was consistent. Five judges would assign a dunk an integer from 1 to 10, with greater values indicating a more athletic, creative, or stylistic dunk. The scores were summed to yield a score for a dunk, with a max sum of 50 points.
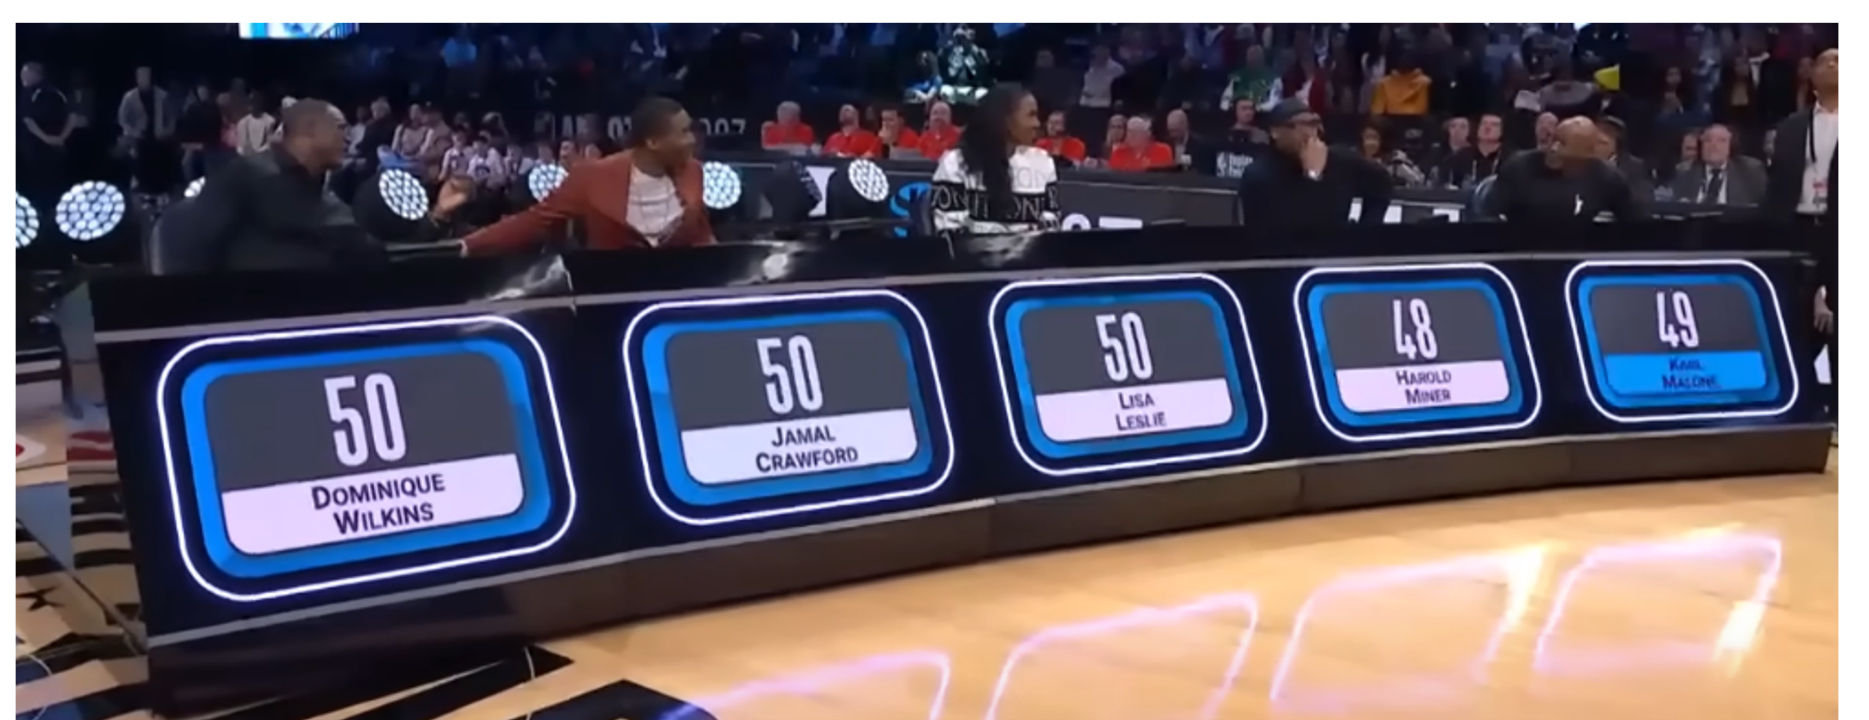
In 2023, the scoring methodology was changed so that five judges would each assign an integer from 1 to 50, and the final score would be the average of those 5 scores. This was done to make it easier for judges to differentiate dunks of similar caliber. I want to investigate whether this scoring change is an improvement.
What makes a good scoring methodology? Is it a larger spread of scores, indicated by a larger score variance? Should scores follow a Gaussian distribution, or another distribution? Should scores be consistent between rounds or dunks of similar quality? I will focus on identifying whether the new scoring method offers more chances for judges to differentiate between athletes.
First Pass Analysis
As a first pass, I will manually count all possible score combinations of the first method, and all possible scores combinations of the second method.
2000 – 2022 Scoring Method (first method)
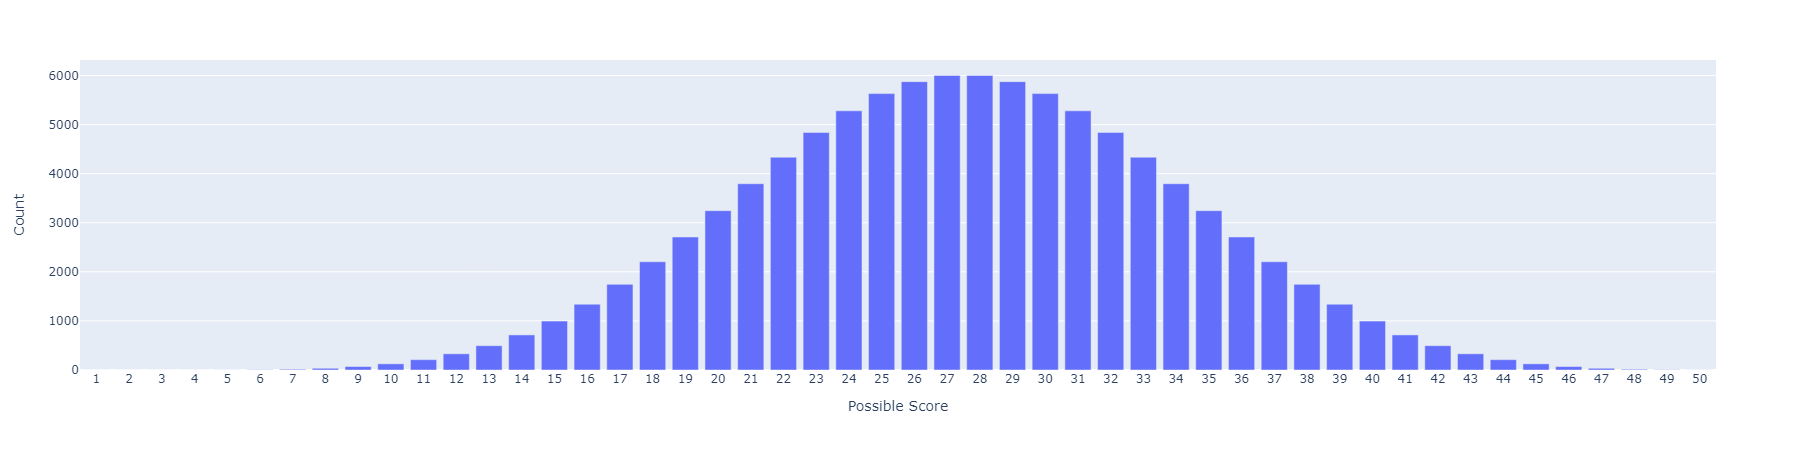
Assume all scores between 1 – 10 are equally likely. Also, assume each of the five judges is distinct. This means there are \(10^5\), or 100,000 possible ways to generate scores. If we generate all possible score values, we see that it forms what looks like a Gaussian distribution, as expected according to the Central Limit Theorem:
2023 – Present Scoring Method (second method)
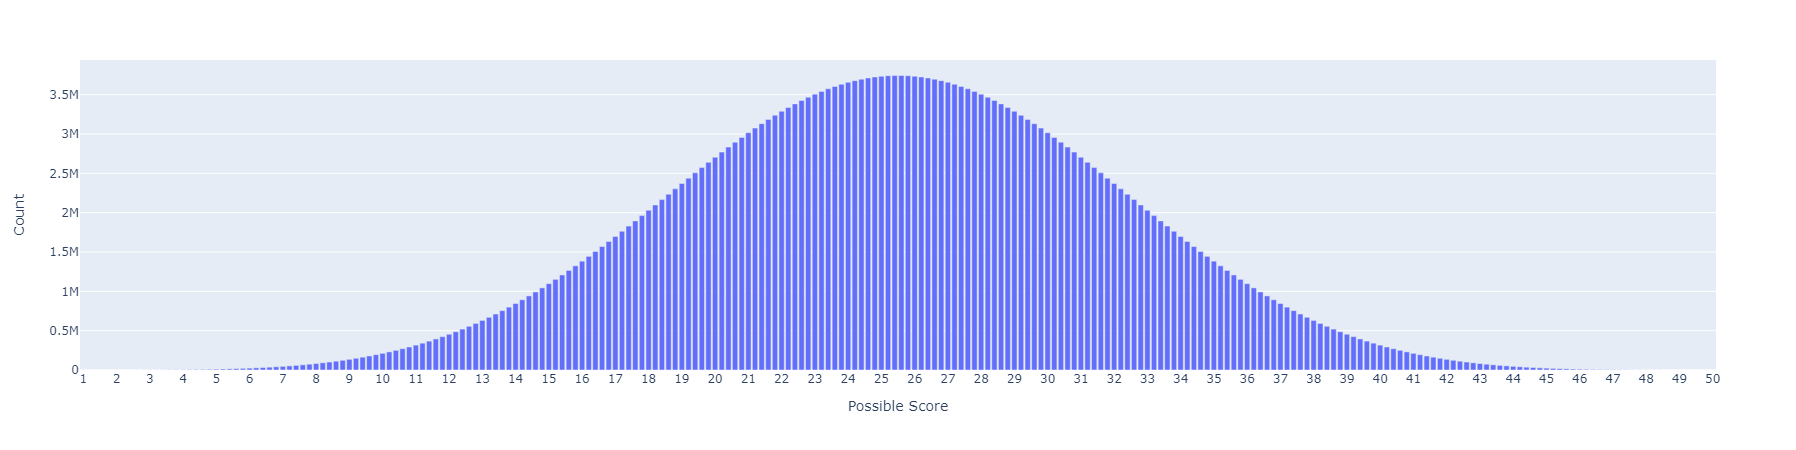
Similarly, assume all scores between 1 – 50 are equally likely and that each of the five judges is distinct. This means there are \(50^5\), or 312,500,000 possible ways to generate scores. And as we would expect from the Central Limit Theorem, all possible score values form what looks like a Gaussian distribution:
Historically, we see that over 80% of scores awarded are greater than or equal to 40. The following histogram is the distribution of awarded scores for dunks from 2000 – 2023 [1] (scores from both first and second methods combined):
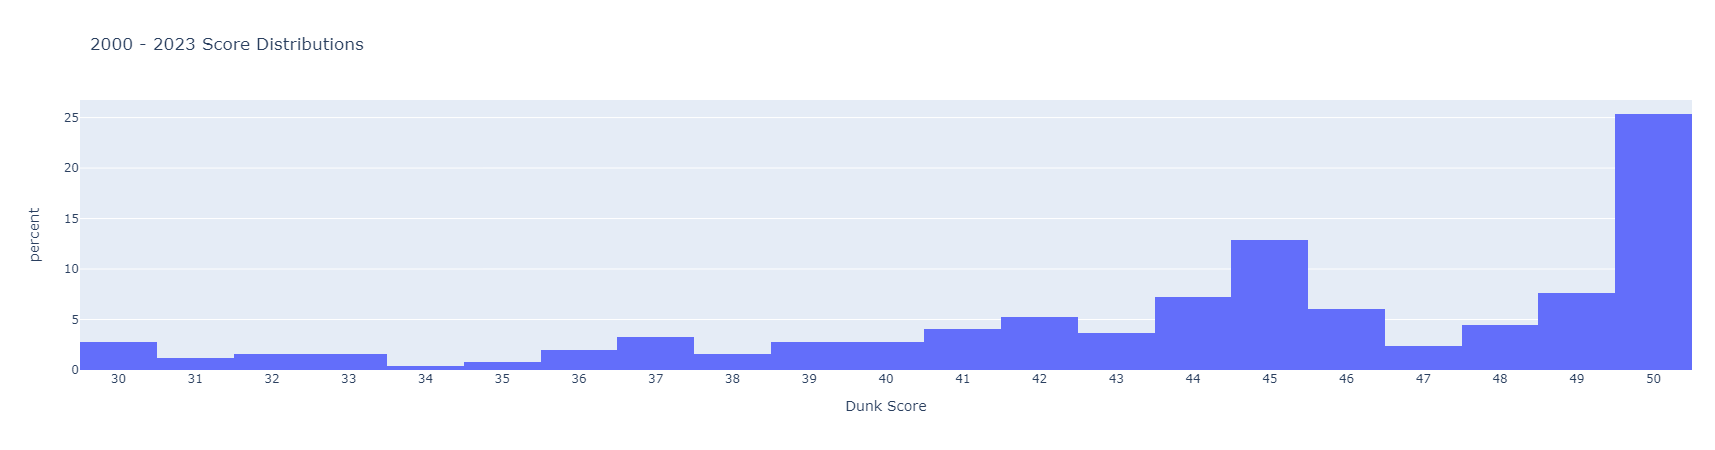
The first scoring method has 2,998 ways to generate scores greater than or equal to 40. The second scoring method has 3,478,756 ways! In terms of possible scores, there are 11 possible scores in the first method greater than or equal to 40 (40, 41, 42, etc.) For the second method, there are 51 possible scores (40.0, 40.2, 40.4, etc.)
From just counting, we can see there are more opportunities for judges to differentiate between top dunks with the second scoring method compared to the first scoring method. The larger variance of the second method also supports the idea that it has a larger possible spread of scores, as seen in Table 1.
| Table 1 | First method | Second method |
|---|---|---|
| Median | 27.5 | 25.5 |
| Mean | 27.5 | 25.5 |
| Variance | 180.17 | 202.54 |
Second Pass Analysis
Of course, not all scores between 1 and 10 or 1 and 50 are equally likely. As mentioned before, we can clearly see that in the past, greater than 80% of scores were greater than or equal to 40. A better analysis would be to create a probability mass function of dunk scores from 2000 – 2022, and a PMF of the dunk scores from 2023, and compare the spread of each.
We have 236 scores from 2000 – 2022. Unfortunately, we only have 12 scores for the new method from 2023, which is too small of a sample size to create a meaningful PMF. I will need to approximate a distribution for the new method. We can use the 2000 – 2022 data to model the outcomes of a dunk contest in the old method as a multinomial random variable where:
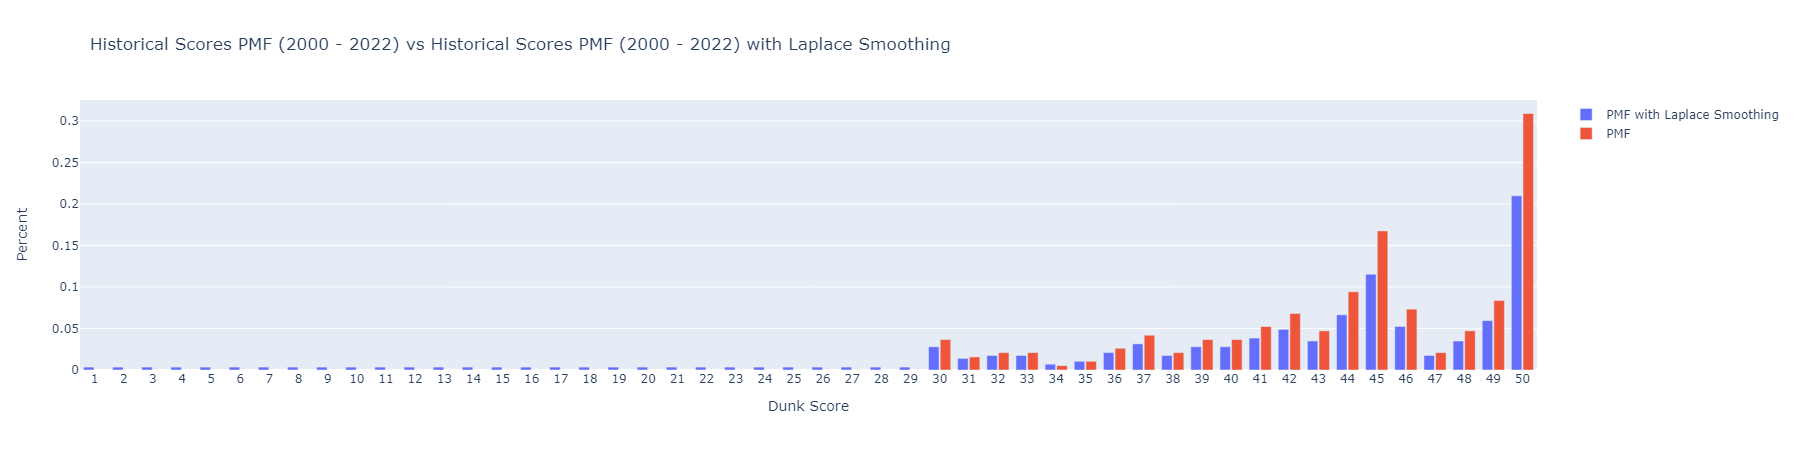
\[P(X_1 = s_1, X_2 = s_2, \ldots, X_{50} = s_{50}) = \binom{n}{s_1, s_2, \ldots, s_{50}} p_1, p_2, \ldots, p_{50}\]where \(X_1, X_2, \ldots, X_{50}\) correspond to score outcomes of \(\{1, 2, 3, \ldots, 50\}\) and \(p_i = \frac{\text{number of times score i was given + 1}}{\text{total number of dunks + 50}}\).
All of the scores in my dataset were between 30 – 50, so I used Laplace smoothing to give the scores from 1 – 29 a chance of occurring, as they also are valid scores.
To create a PMF for the new method, I will model a judge as a random variable \(J_1\), which is distributed by the PMF with Laplace smoothing I defined above. Then, I will model the other 4 judges as RVs \(J_2,J_3,J_4,J_5\) where \(J_i=J_1 \pm 2\). I am assuming (pretty strongly) that judges will give scores within 4 points of each other. A study of Olympic Games judges showed that standard deviation of judging error for the halfpipe (which is scored out of 100 points) varied between 1 – 3 points [2]. More formally, for judges \(Ji\), where \(i \in \{2, 3, 4, 5\}\), assume \(J_1 − 2 \leq J_i \leq J_1 + 2\), ignoring values of \(J_i\) that are \(\leq 0\) or \(> 50\). This range is our subset PMF. Here is an example of calculating the probability for one of the values in our subset PMF:
\[P(j_i - 2 | J_1 = j_i) = \frac{P(j_i - 2)}{\sum_{j_1 - 2}^{j_1 + 2} P(j_x)}\]You would calculate this probability for each value in the subset to get the subset PMF. This is the PMF you would sample the other 4 judge scores from. Then, the final dunk score is calculated as a random variable \(D\) where \(D = \frac{J_1 + J_2 + J_3 + J_4 + J_5}{5}\). I will simulate this method by bootstrapping with the following algorithm.
Repeat 100,000 times:
- Sample \(J_1\) from the Laplace smoothed PMF of historical scores
- Create subset PMF of scores \(J_1 \pm 2\)
- Sample 4 scores representing \(J_2,J_3,J_4,J_5\) from this subset
- Calculate mean of 5 scores \(J_1, J_2, J_3, J_4, J_5\)
This creates the following distribution:
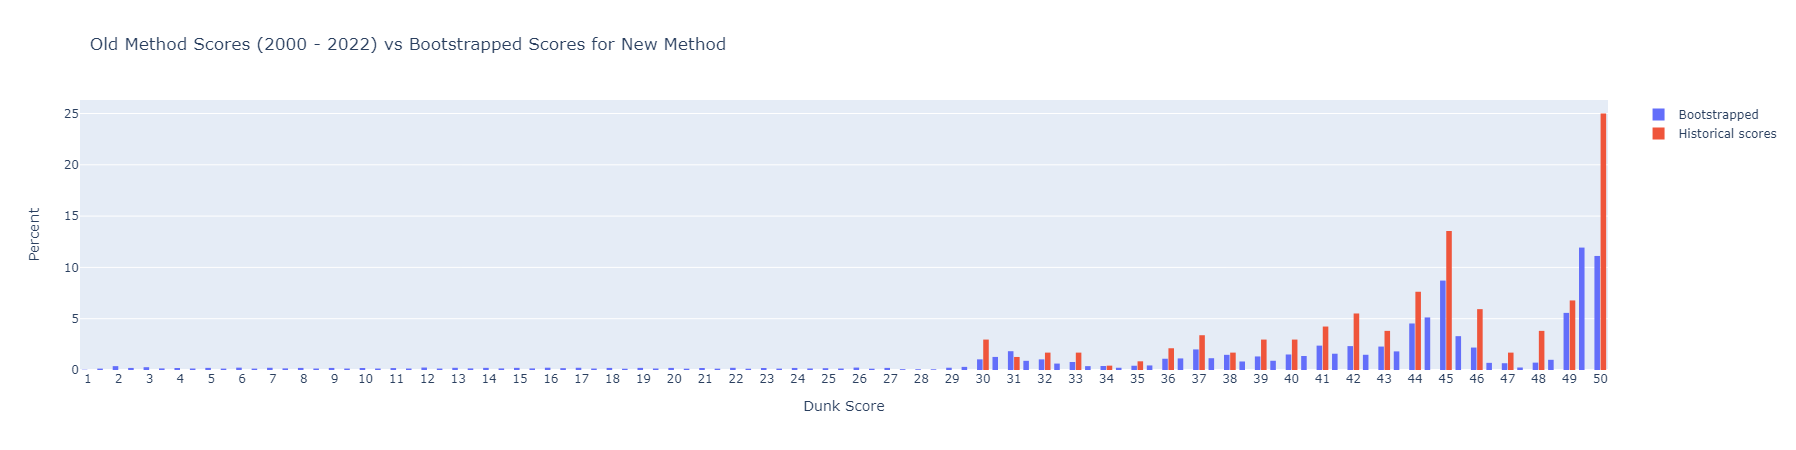
I believe this simulated distribution is more realistic than the one in the first pass analysis. Visually, we can see that there is a larger distribution of scores around the peaks of 45 and 50, which theoretically gives judges more opportunities to differentiate between top dunks. Thus, I argue the new method of averaging 5 scores out of 50 is better than the original method of adding 5 scores out of 10. It is difficult to compare variance of the distribution to historical data as I applied Laplace smoothing. Ultimately, to determine whether the new scoring method is an improvement, we need to wait for more data, as my model made a lot of assumptions.
Other Considerations
The NBA dunk contest is primarily for entertainment, which is probably why there is such a high probability of getting a 50 – the crowd loves 50s! It is also generally understood that judging with explicit numerical scores is not something people are naturally good at. Sequence effects, which is when performing later in a sequence yields better scores, have been in shown in other sports with numerical judging such as figure skating and gymnastics. [3] Popularity of players also influence a judge’s score.
This analysis ignored these factors, but some new judging methods that could reduce sequence effects and other problems with numerical judging include pairwise judging [4] (comparing two players at a time to each other) and anonymous judging (where players are anonymized). Of course, pairwise and anonymized judging would not be as exciting to watch!
References
[1] Slam Dunk Contest. 15 March 2023, 03:30 UTC. In Wikipedia: The Free Encyclopedia. Wikimedia Foundation Inc. Encyclopedia on-line. Available from https://en.wikipedia.org/wiki/Slam_Dunk_Contest. Internet. Retrieved 15 March 2023.
[2] S. Heiniger and H. Mercier, “Judging the Judges:A General Framework for Evaluating the Performance of International Sports Judges,” Aug. 2019, https://arxiv.org/pdf/1807.10055.pdf
[3] J. Barber and E. Rollins, “Factors influencing scoring in the NBA Slam Dunk Contest,” Journal of Sports Analytics, vol. 5, no. 3, pp. 223-245, Aug. 2019, doi: 10.3233/JSA-190242.
[4] https://www.anishathalye.com/2015/03/07/designing-a-better-judging-system/